Statistics in the BIT Portal 2.0
Statistics in the BIT Portal 2.0
Statistics. Because if something isn’t monitored, it doesn’t exist, right?
That’s what we wrote roughly a year ago in a blog post about statistics in the BIT Portal.
But of course, we at BIT haven’t been idle over the past year, so we’ve added even more types of statistics. By now, we have over 6,000 dashboards with statistics for our customers in the BIT Portal…
TL;DR – What statistics did we already have?
These are described in more detail in our previous blog post.
Data Centre:
- Power usage
- Temperature
Hosting:
- Basic statistics for virtual machines: CPU, disk I/O, network, memory
- Virtual data centre overview
Jitsi:
- Jitsi service statistics
Load Balancing:
- Statistics per VIP
- Statistics per Pool
Network:
- BIT Network global latency
- BIT Network global packet loss
- Traffic statistics per port
- Total traffic statistics
Storage:
- Shared storage (CephFS) statistics per share
What’s new?
Shared hosting
We’ve recently introduced traffic statistics for shared hosting. For each website, you can see the number of hits and the amount of data traffic per day. 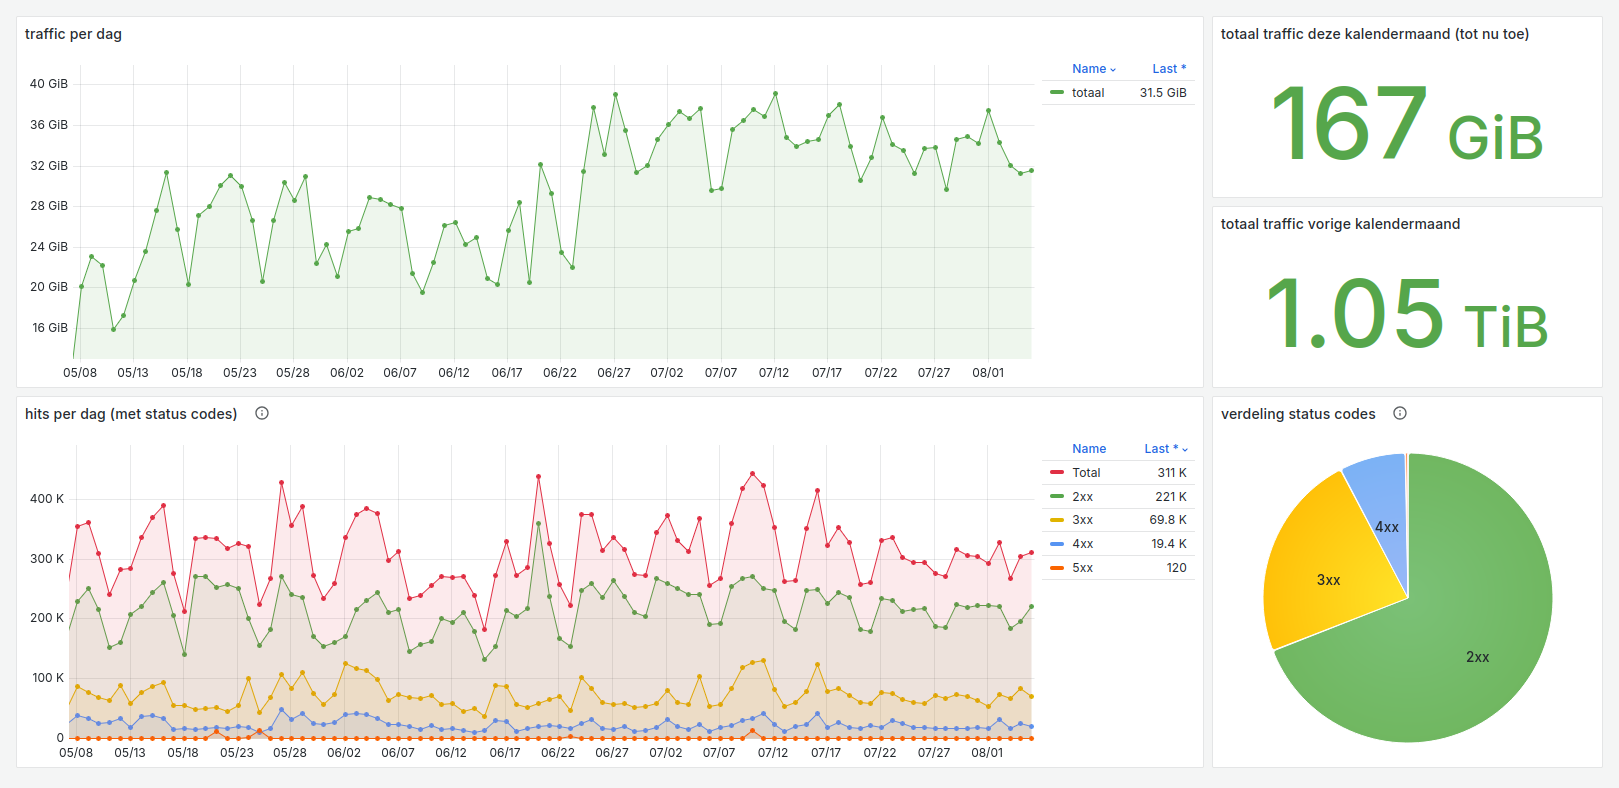
Additionally, you can see the distribution of HTTP status codes for those hits. Ideally, you’ll mainly see 2xx and 3xx codes for pages and redirects that were processed correctly. But if the 5xx server error codes start rising, something’s wrong that needs attention.
Finally, you can easily see how much traffic has been used so far this month and compare it with the total from the previous calendar month.
Server Statistics
We already had statistics for each virtual machine you use. This data comes from the hypervisors without accessing the virtual machine itself, so it’s quite limited: only CPU, network, disk I/O, and (sometimes) memory.
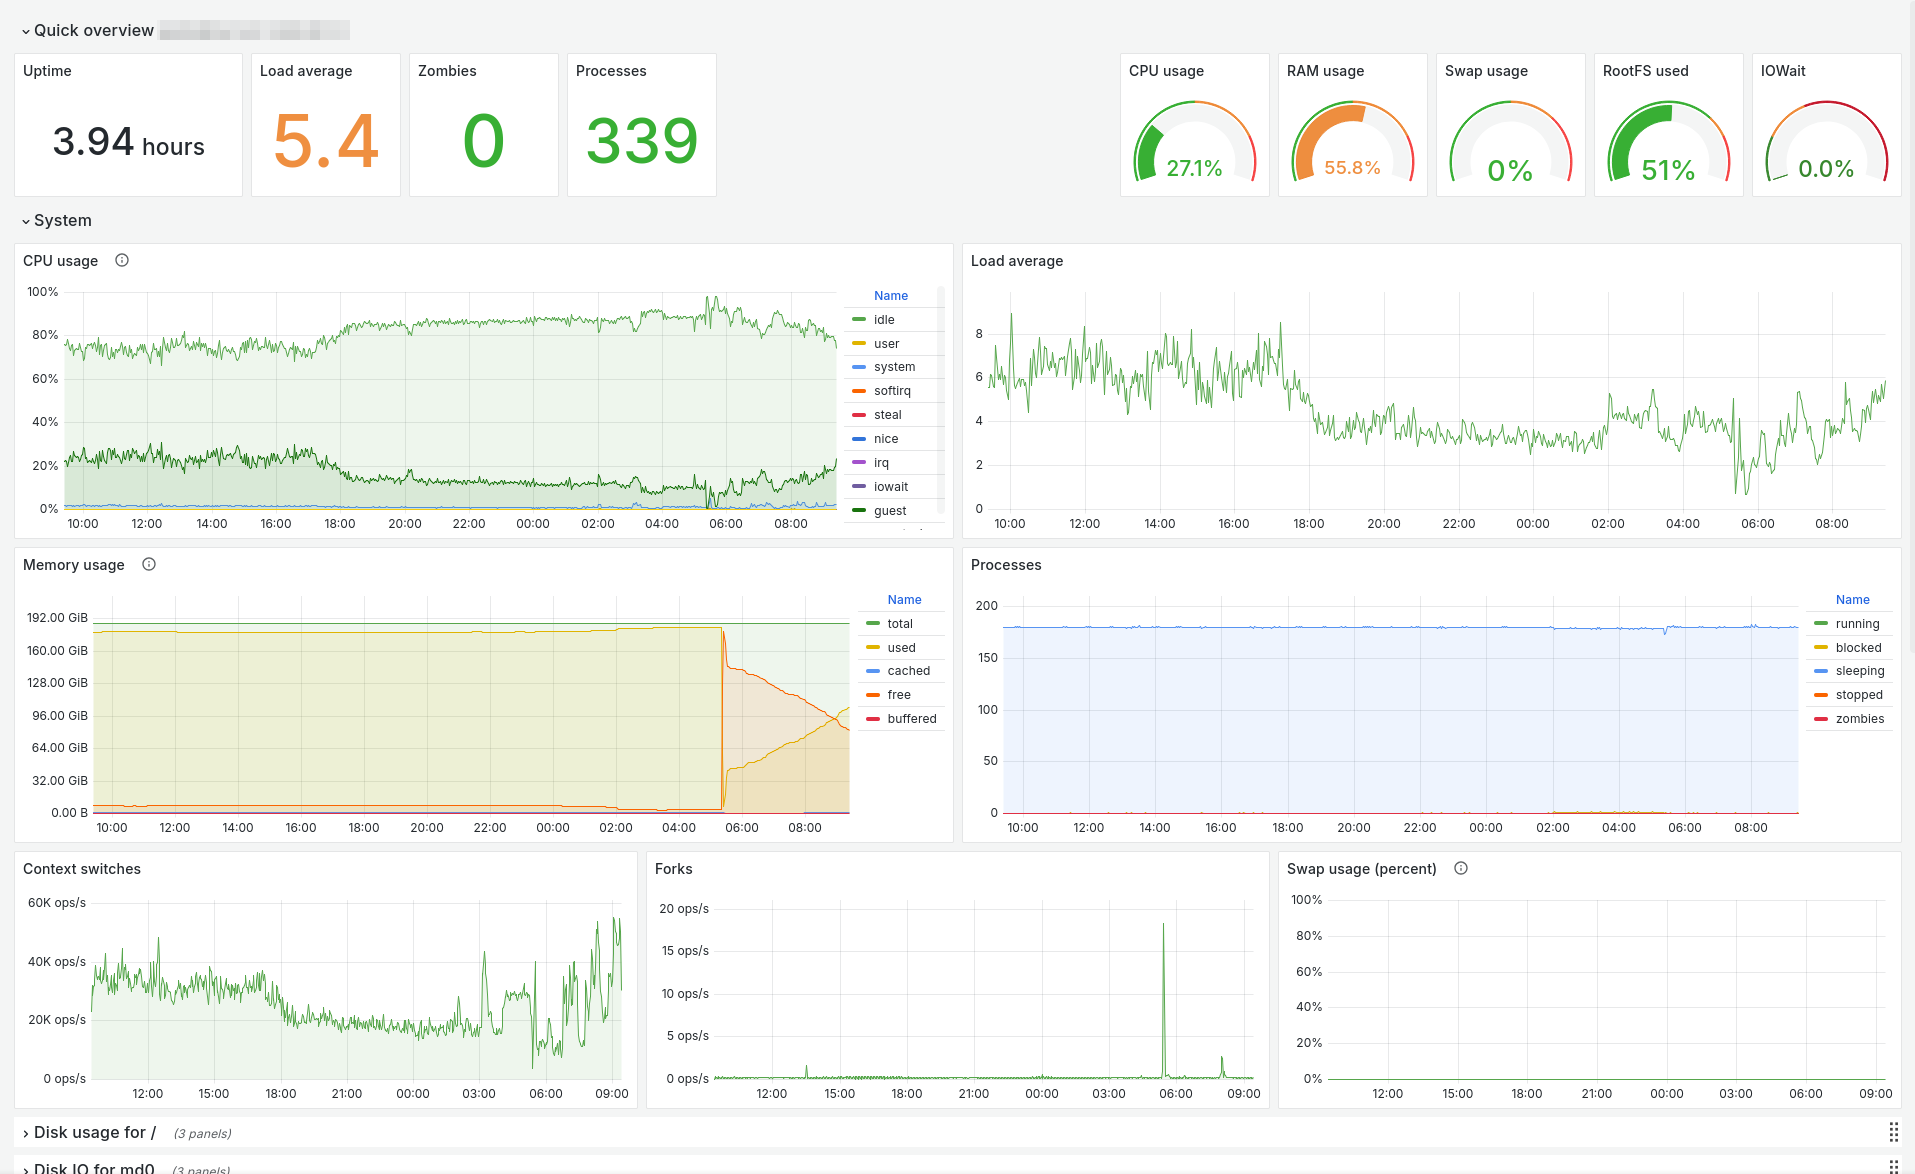
For customers who take our server maintenance services, we’ve recently replaced this basic dashboard with much more detailed statistics, giving you far greater insight into what’s happening on a server—such as extensive CPU and memory statistics, disk usage, and process information.
And because this data now comes from the server itself rather than the hypervisors, these dashboards are also available for customers with physical servers.
Ceph Storage
In addition to statistics for CephFS shared storage, we now also have statistics for customers using a Ceph storage pool.
Backups
Backups. So basic, so essential—who wouldn’t want backups?
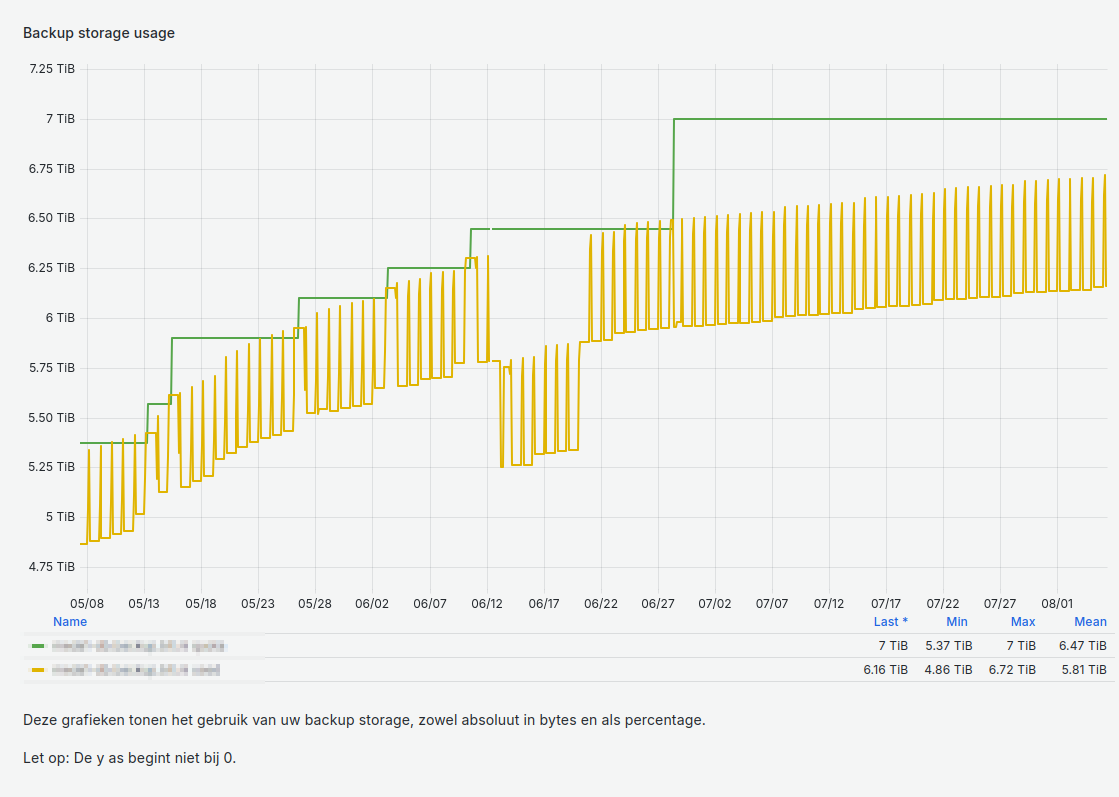
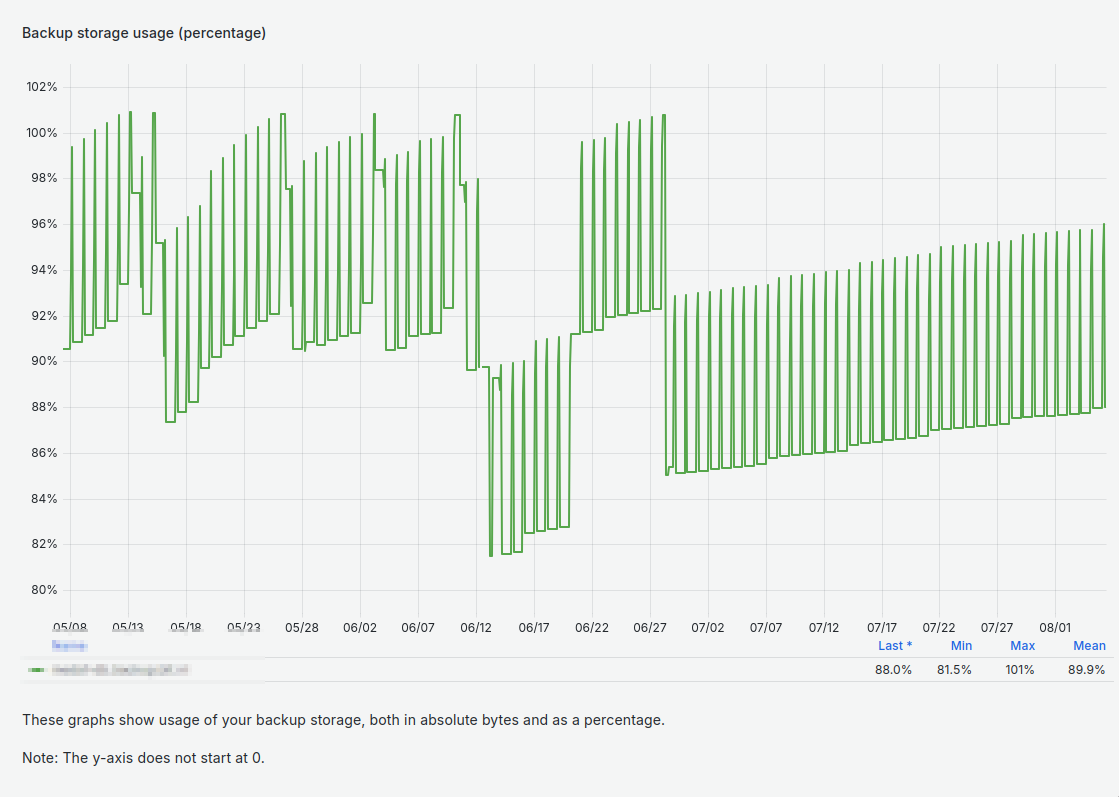
That’s why it was high time we started displaying statistics for them too. Two graphs per backup volume: relative as a percentage of the quota, and absolute in gigabytes or terabytes.
Missing Something?
The above are standard services. Looking for something not listed here? Have specific requests? Custom solutions are also possible.
By: The people at BIT
